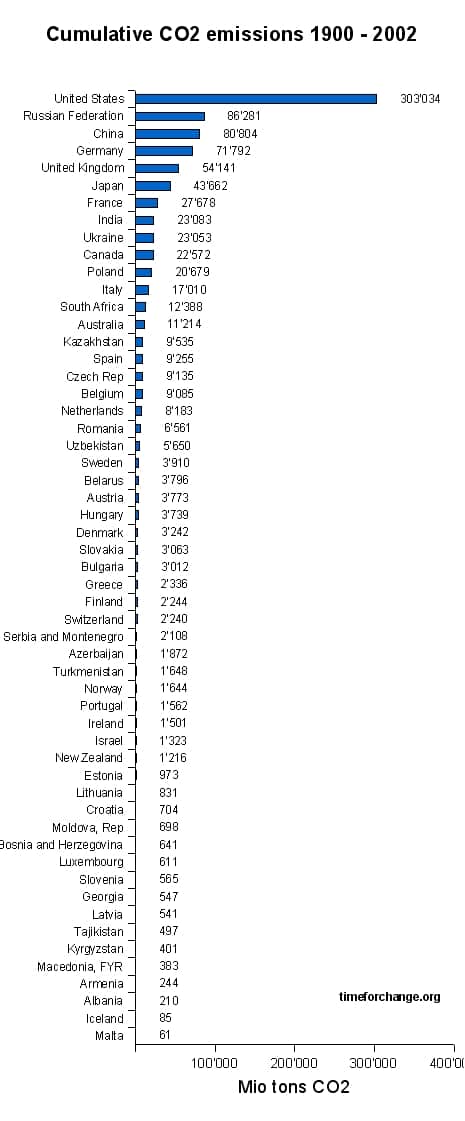
The following graph shows the cumulative CO2 (carbon dioxide) emissions by country for the years 1900 until 2002. This is the sum of all CO2 emissions in the years 1900 until 2002 for each developed country. Data source was the World Resources Institute (WRI).
On the page link here, you can find the CO2 emissions by country and/or per capita by country .
It does make sense to look at the sum of all CO2 emissions because the lifetime of the greenhouse gases like CO2 in the atmosphere is between 50 and 200 years. The current global warming is an effect of all greenhouse gases put in the atmosphere during the last 100 years, global warming is not just caused by the greenhouse gases emitted this year or last year! This is also one of the reasons why immediate action is required to reduce the emission of greenhouse gases like carbon dioxide, because the effects of the greenhouse gases will last for about 100 years.
The chart with the sum of carbon dioxide emissions (carbon footprint ) therefore shows the accountability for the current situation.

How do Human CO2 emisions compare with natural sources
Great Chart!
How do Human CO2 emisions compare with natural sources such as volcanos, stable rotting jungles, animals other than humans….
I have seen a couple of charts that show one or the other but non of the Climate Change sites seem to put total human CO2 emmisions since 1900 into perspective the the natural sources. I do not know if this is intentional but it certainly makes us easy targets for anyone who wants to claim we “spinning isolated facts” without providing comparative facts.
-T
Comments are closed.